Have you ever spent a late-night study session staring at a metabolic pathway or a multi-layered engineering schematic, wishing you could just "Control+F" the image for answers? We’ve all been there. For years, visual data has been a total "black box" for software. You could search your text, but diagrams remained silent, static, and often frustrating.
That’s changing. Today, ai diagram recognition is helping students. It turns complex images into dynamic, searchable, and explainable insights.
At SuperKnowva, we believe that understanding a diagram is just as vital as reading a paragraph. We’re breaking down the sophisticated tech that finally allows AI to "see" and interpret the complex visual language of academia.
The Evolution of Visual AI in Education
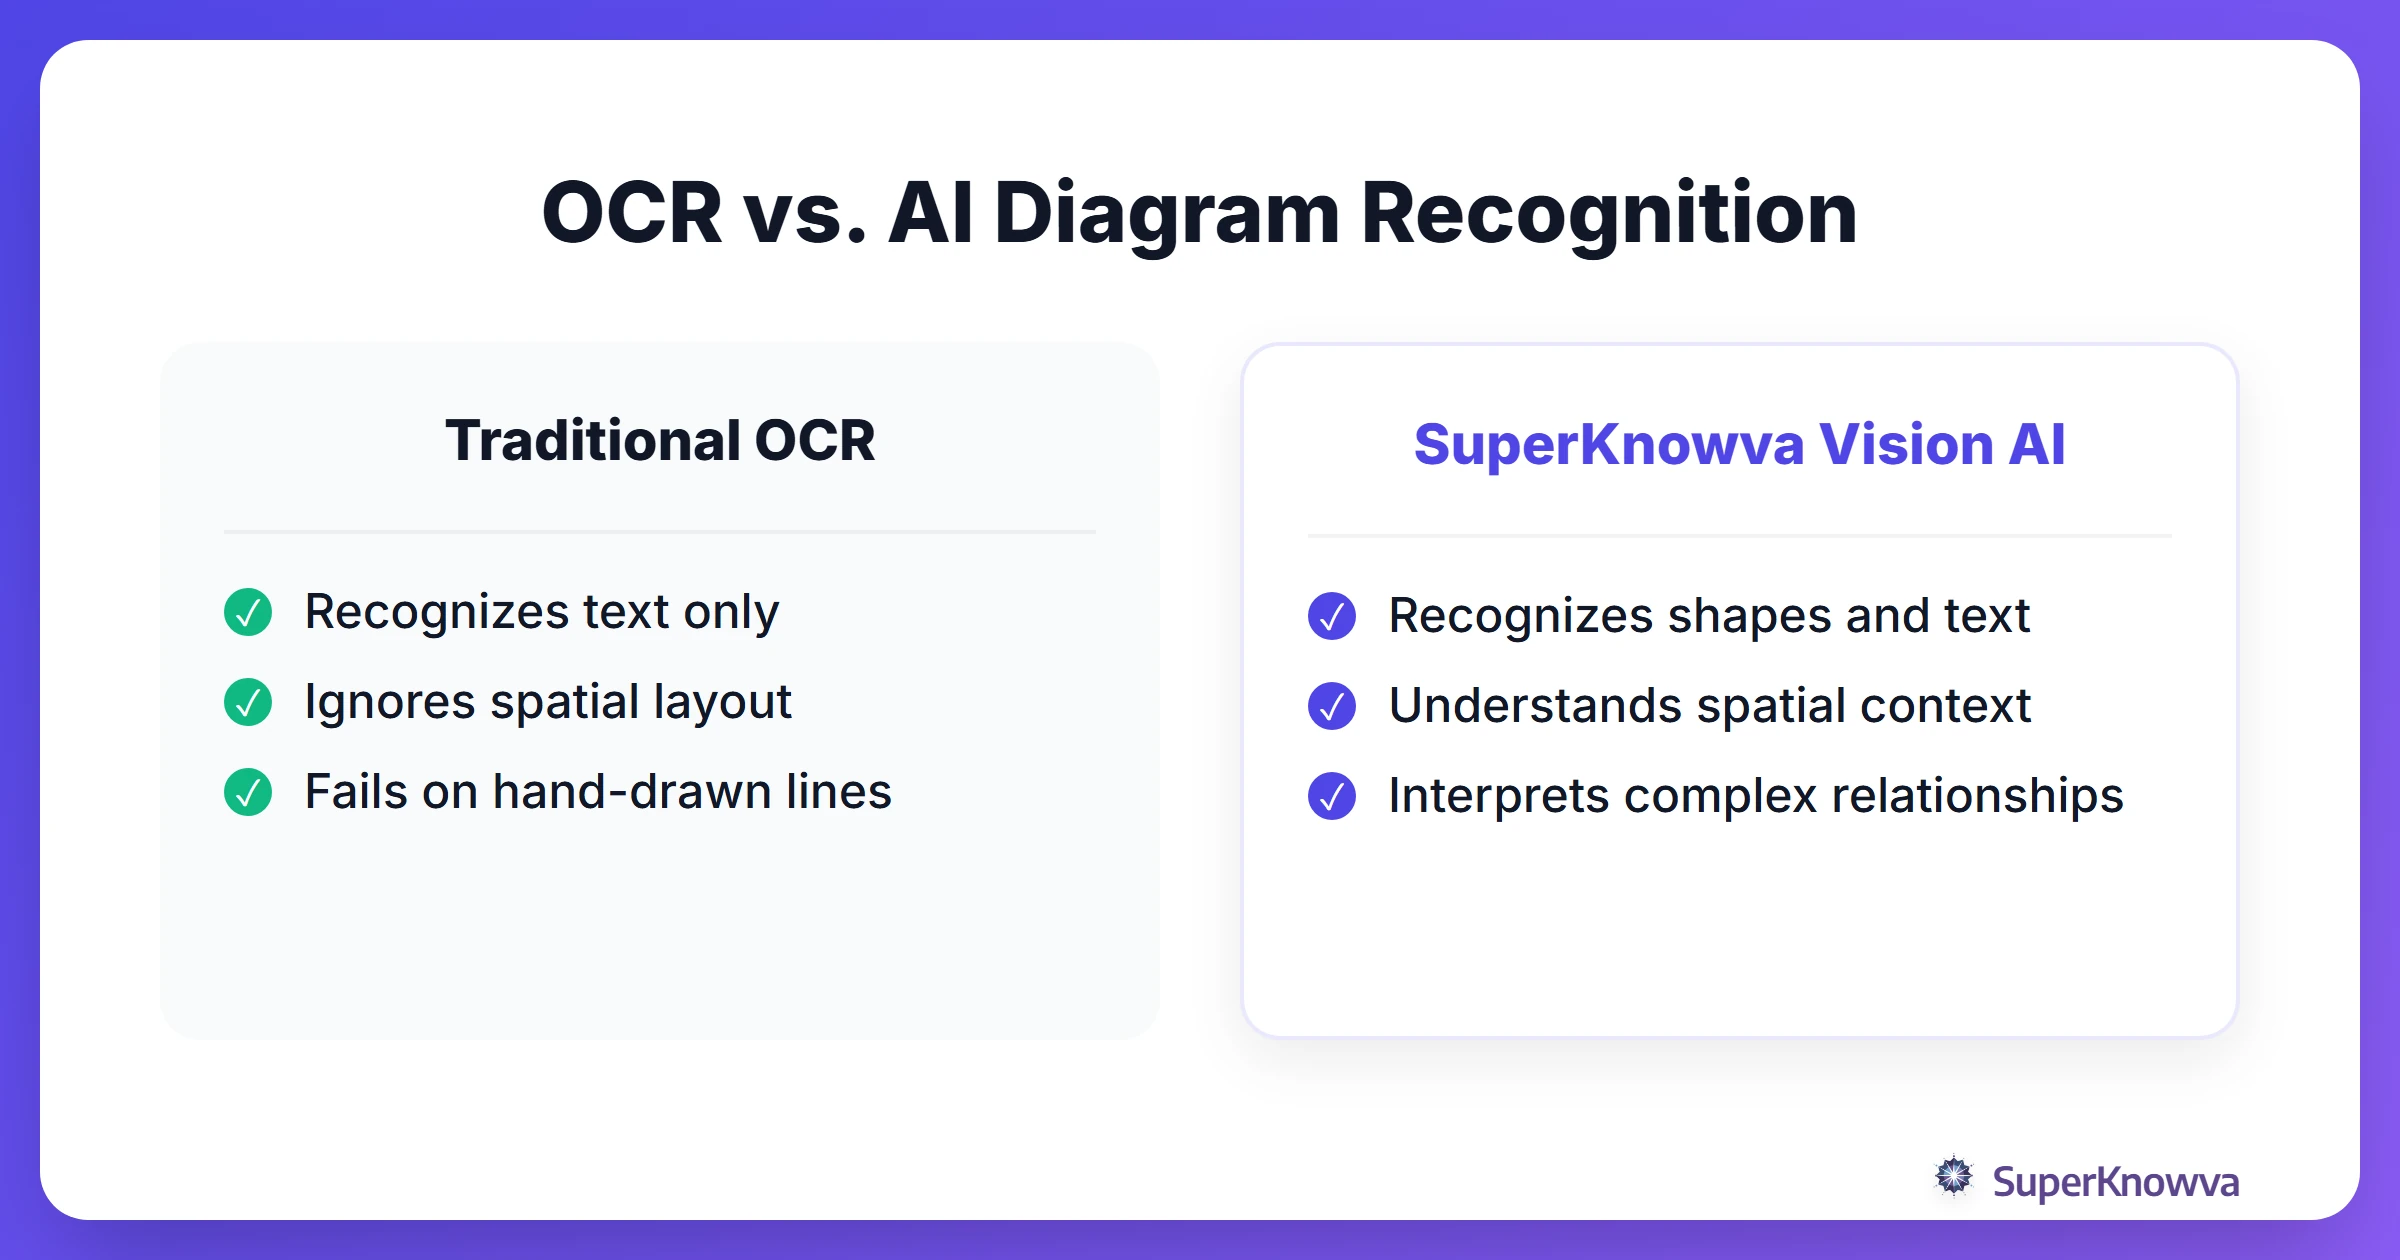
The story of computer vision in education started with simple Optical Character Recognition (OCR). Think of early OCR as a digital photocopier; it could recognize letters and numbers, but it was "spatially blind." It couldn't tell the difference between a figure caption and a data point if they weren't sitting in a perfectly straight line.
Diagrams require spatial reasoning. In a textbook, a line is not just a decoration; it is a connection, a vector, or a boundary. Traditional systems often invent details or ignore these connections completely.
SuperKnowva bridges this gap. We’ve moved beyond simple text extraction by using advanced neural networks. We don't just "read" the image; we transform it into an interactive learning experience where you can query specific parts of a visual and get an answer that actually makes sense in context.
How Computer Vision Actually "Sees" a Diagram
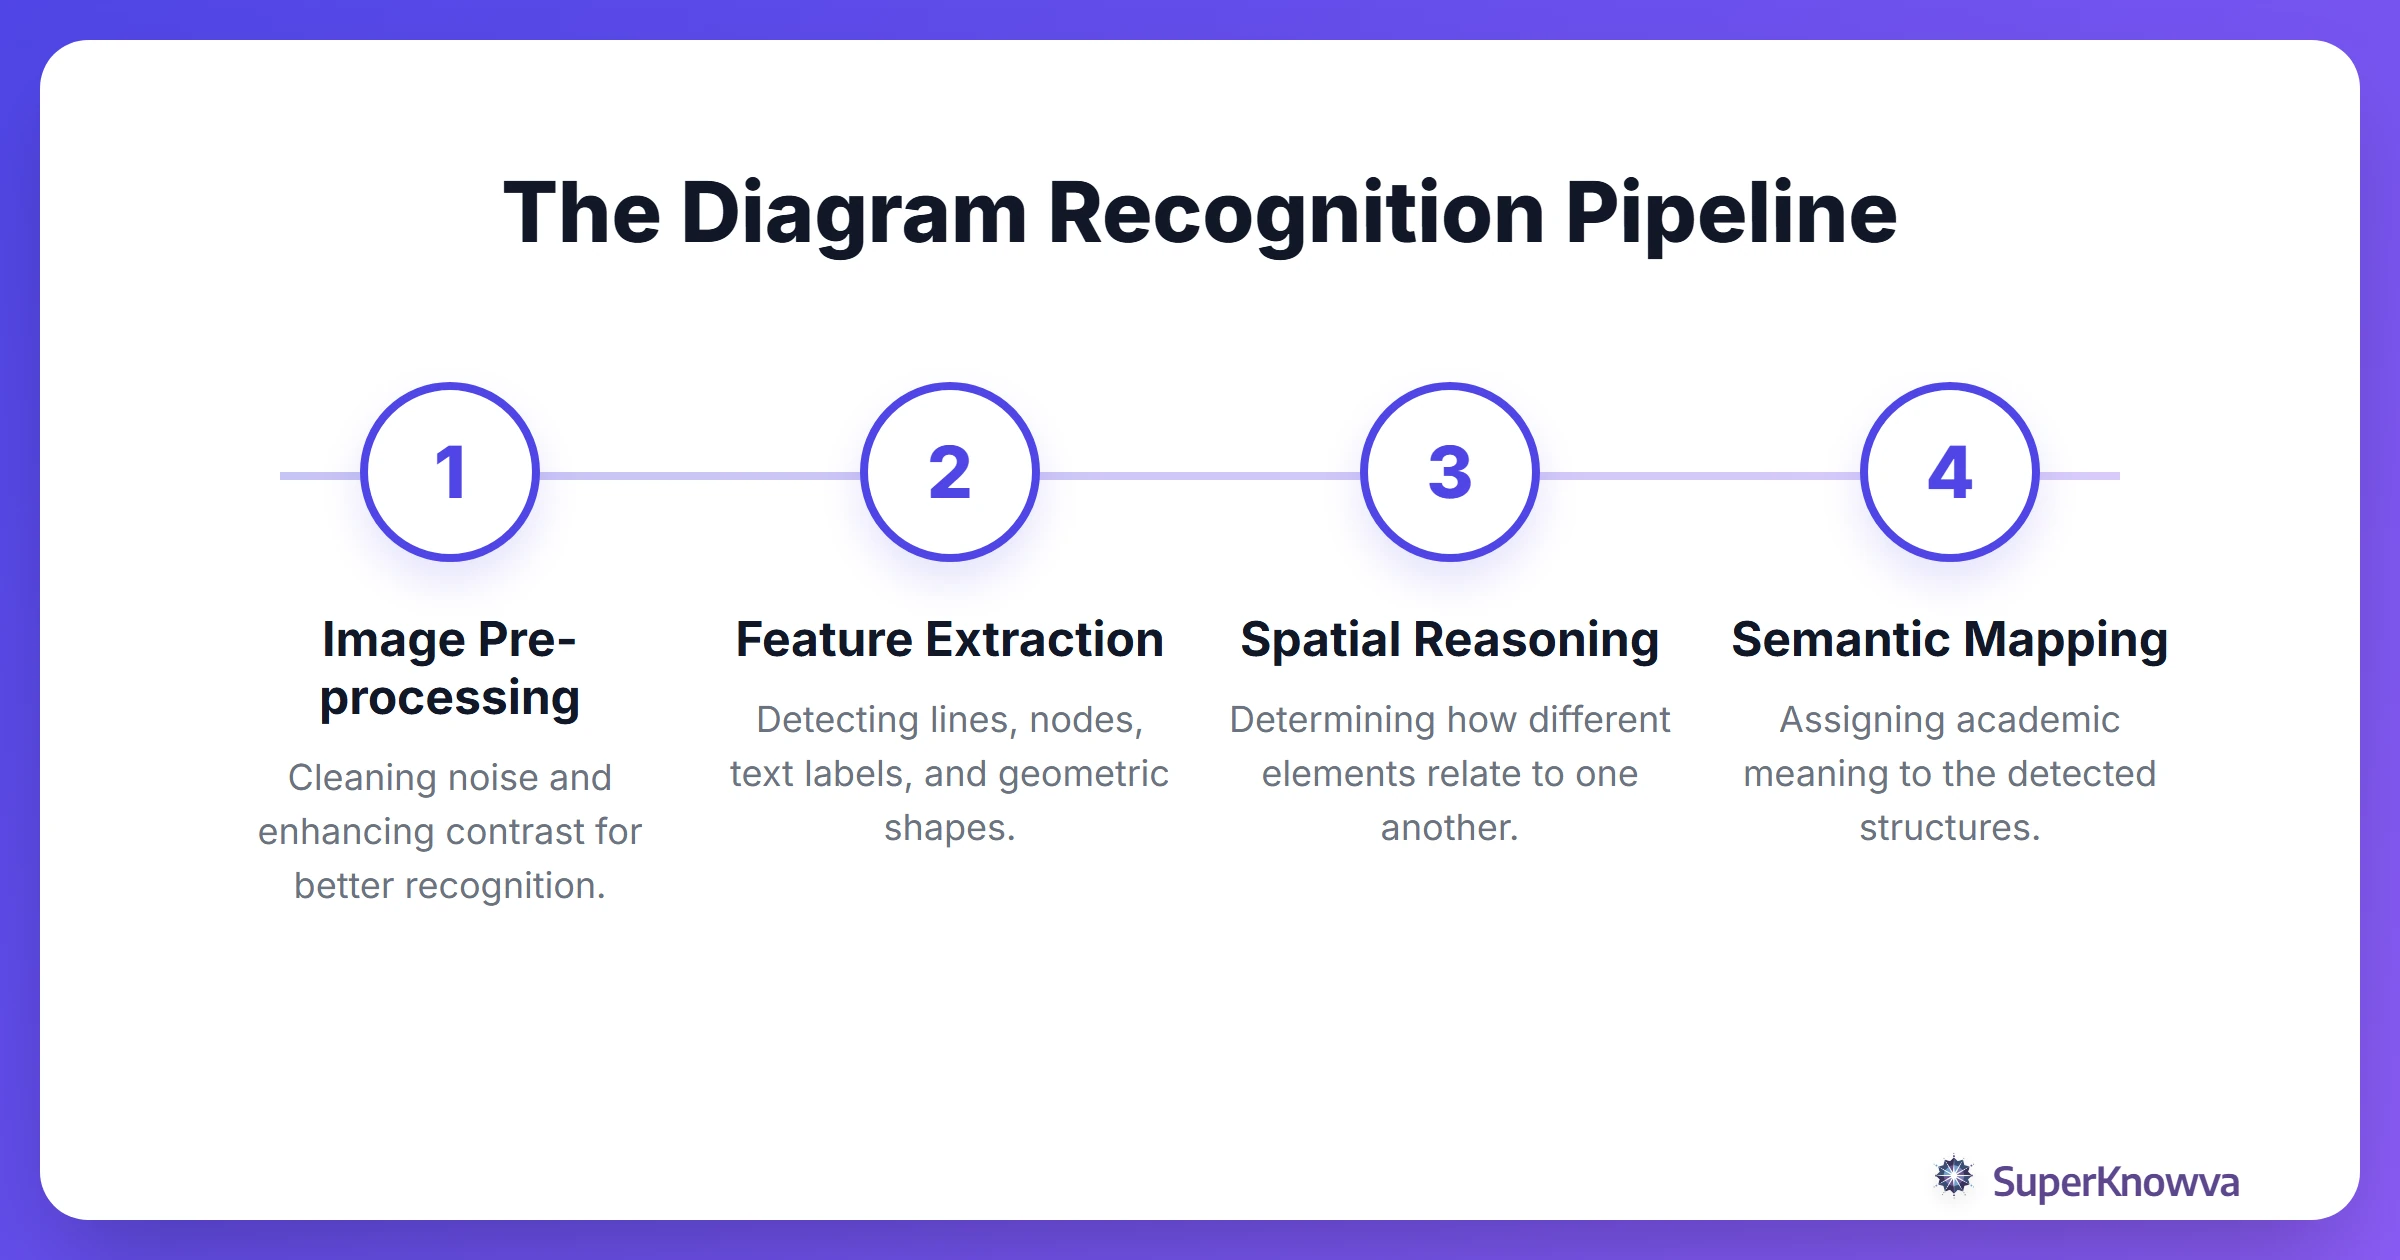
When you upload a schematic, the AI isn't just looking at a "picture." It’s performing a high-speed, multi-layered analysis to master the image to schematic process.
- Pixel-Level Analysis: Scanning edges, contours, and gradients separates the diagram from background noise.
- Object Detection: Identifying geometric shapes such as circles, squares, and triangles categorizes elements as nodes or connectors.
- Contextual Awareness: Distinguishing between similar visuals like chemical bonds and circuit wires requires evaluating surrounding labels and image patterns to identify the subject as an organic molecule or a computer motherboard.
Industry leaders like Google Cloud Vision AI paved the way for this, providing the foundational tech that allows educational platforms to scale these complex capabilities for millions of students.
Deciphering Charts and Graphs with Precision
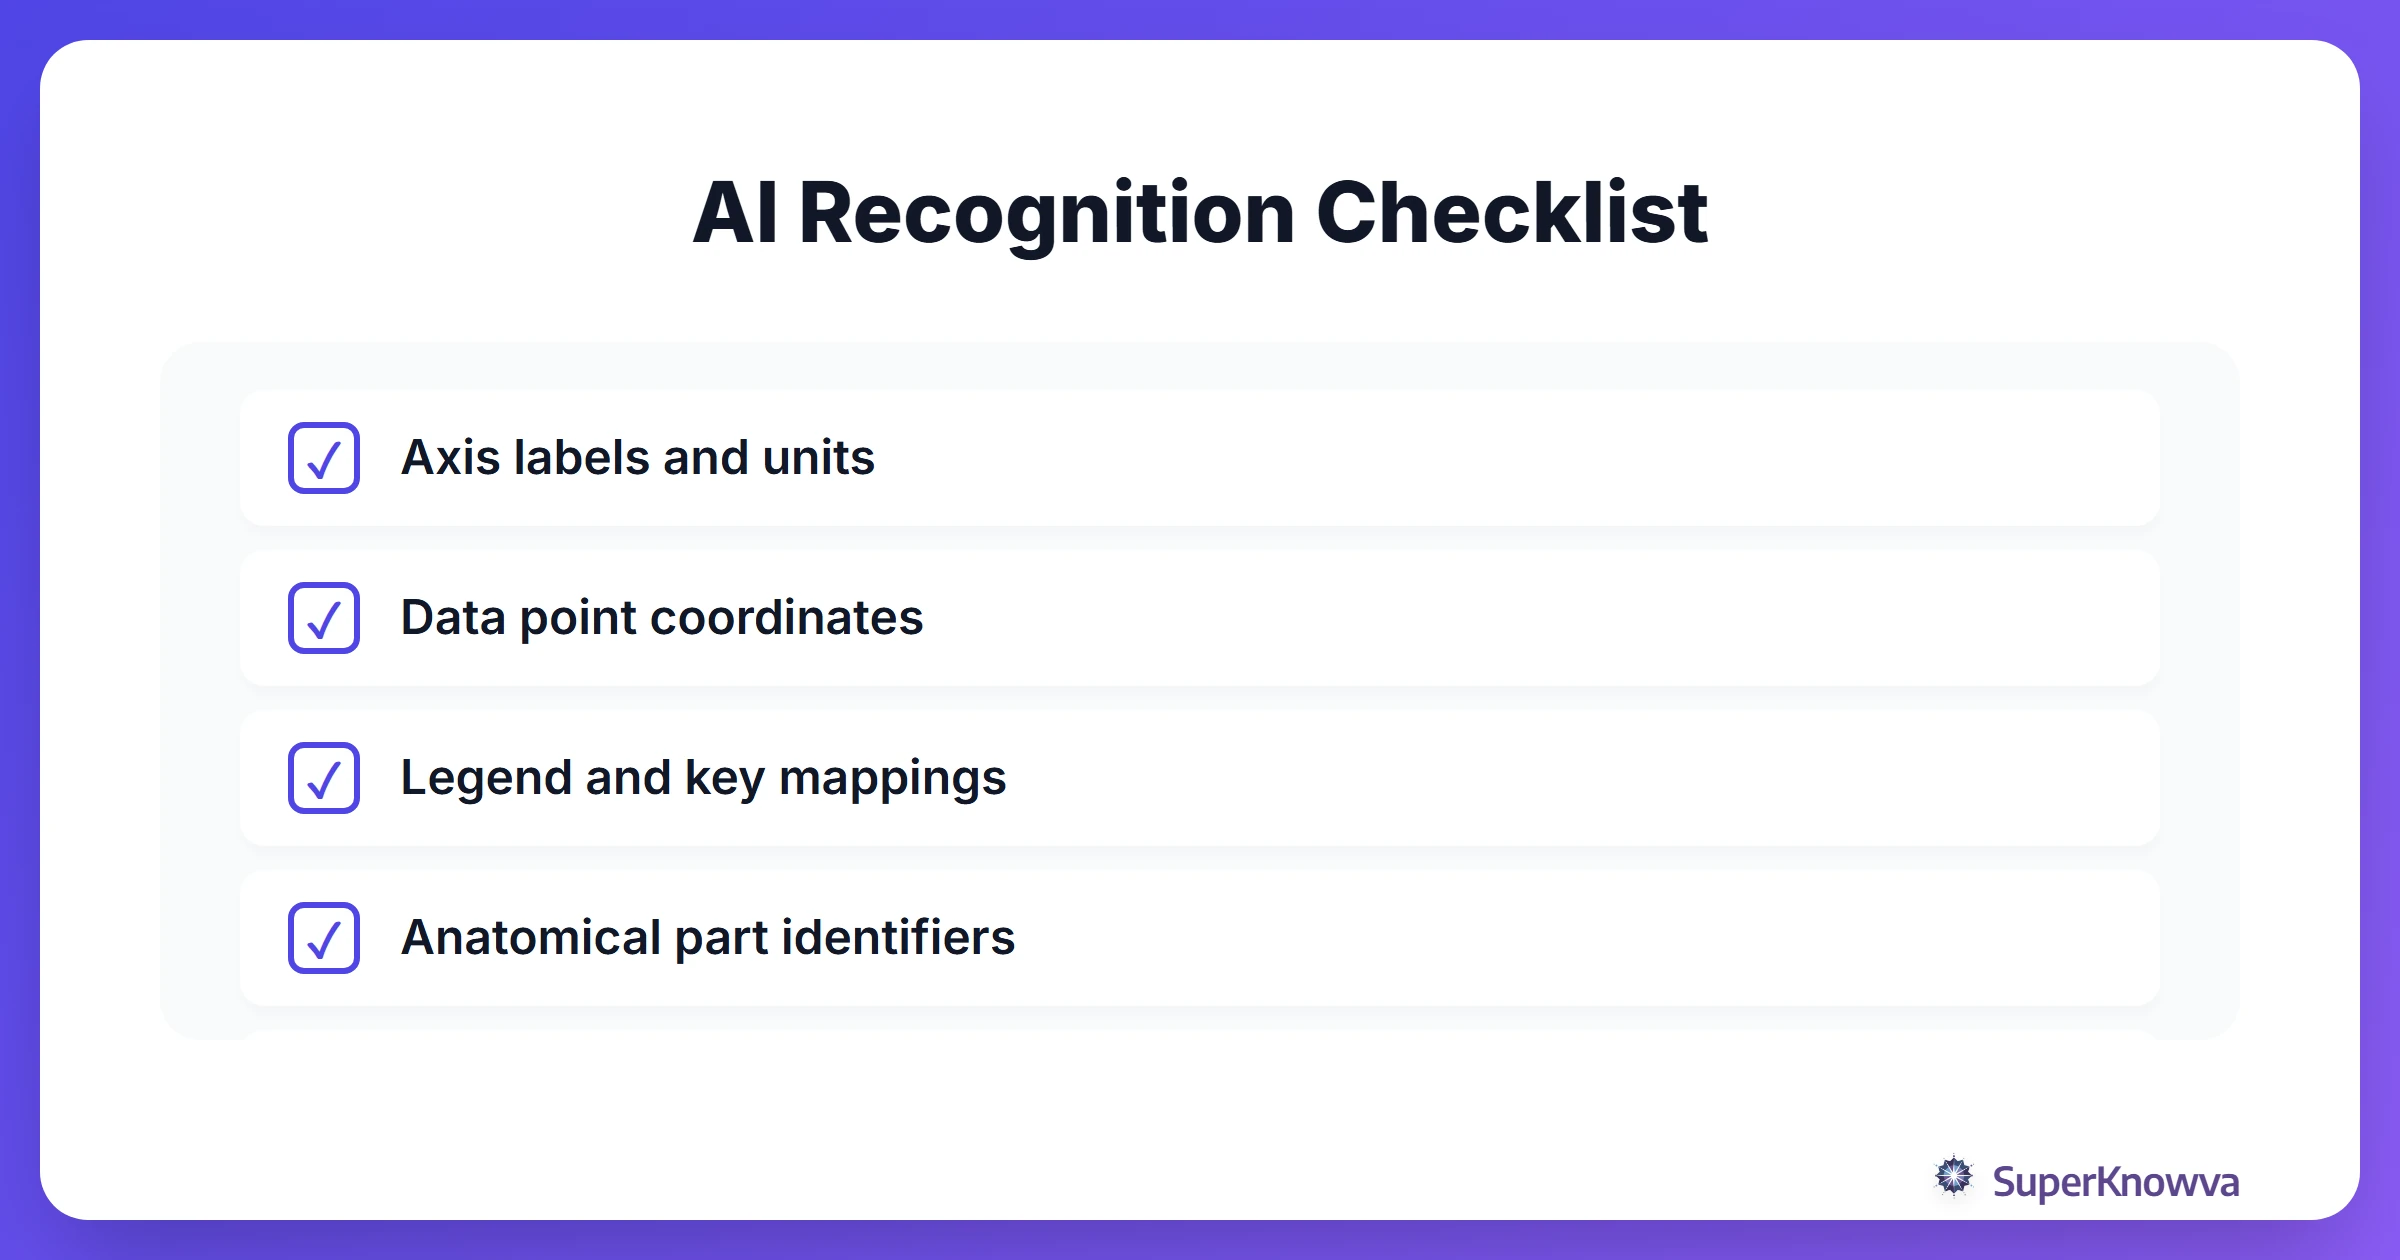
Let’s be honest: the hardest part of any lab report is usually the graph. Modern visual learning AI is a lifesaver here because it can extract raw data points from X and Y axes with incredible accuracy.
Instead of just seeing a "blue line," the AI identifies the trend, calculates the slope, and checks the legend to see what that line actually represents (like "Rate of Reaction over Time"). It can then turn that visual data into a structured table or a plain-English summary. It’s like having a data scientist sitting next to you while you take notes.
This is a major reason why AI-powered note-taking is so effective. You can now drop a complex graph into your notes without losing the underlying data that makes the graph important.
Anatomical and Scientific Diagram Analysis
In fields like medicine, there’s no room for "close enough." AI for medical students has to handle extreme complexity, from professional textbook illustrations to messy, hand-drawn sketches from a lecture.
Recent research published in Nature: Enhancing Hand-Drawn Diagram Recognition shows how deep learning is finally conquering the quirks of human drawing. SuperKnowva uses these breakthroughs for label-to-structure mapping. If you’re looking at a cross-section of the heart, the AI understands exactly which valve the "Aorta" label is pointing to. It helps you see the physiological system as a whole, rather than just a bunch of arrows and labels.
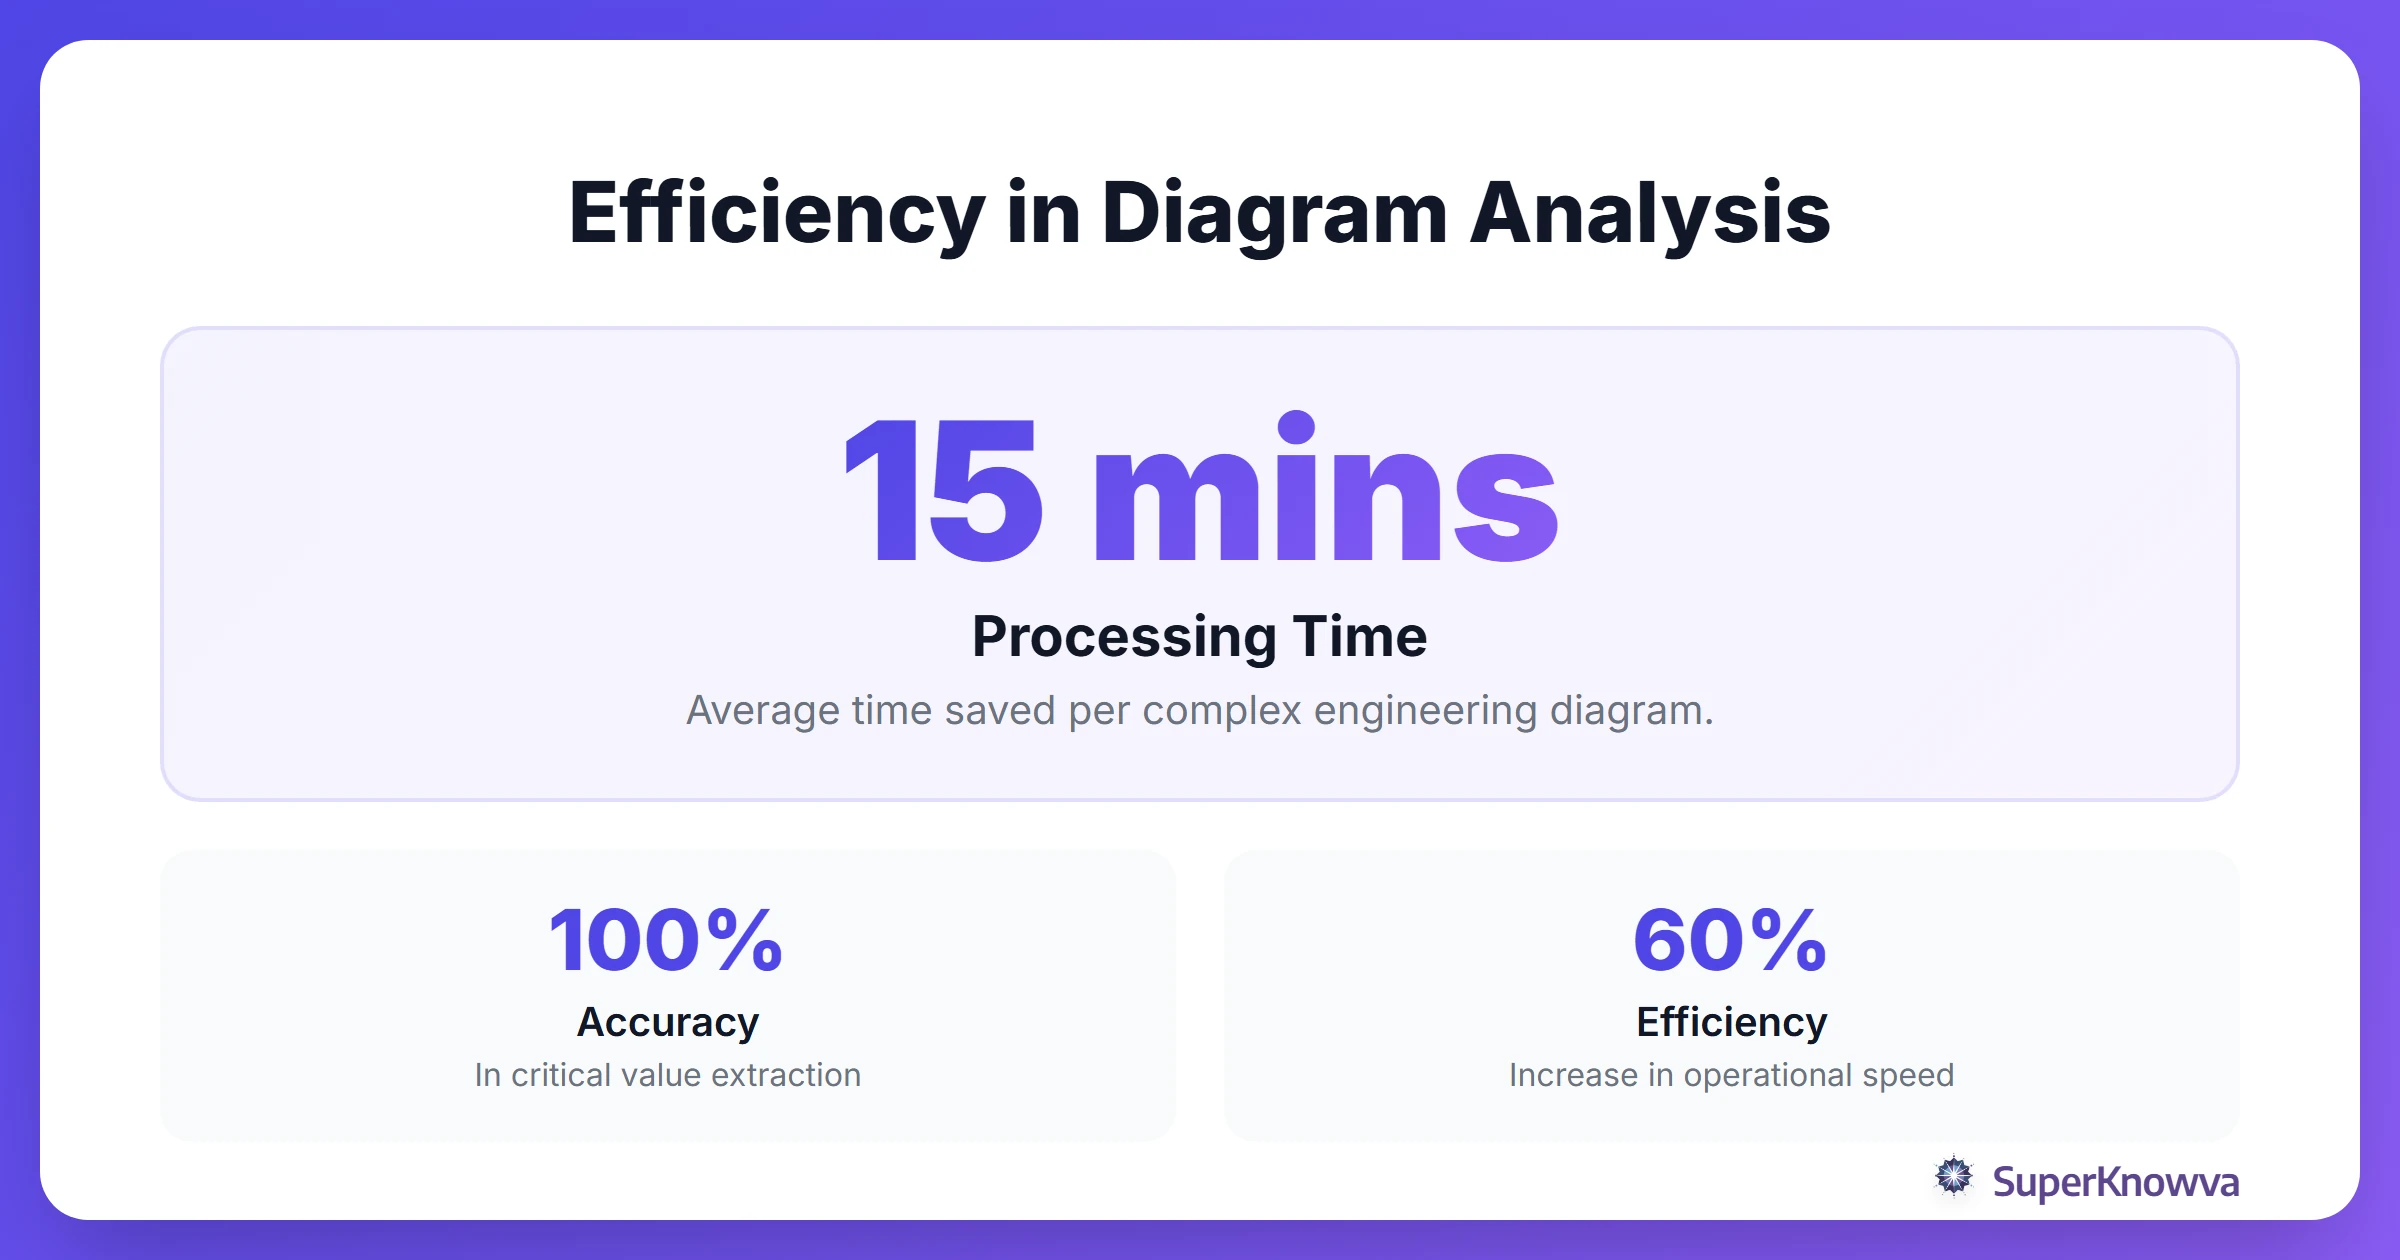
This tech isn't just for biology. Case studies in AI in Engineering Diagrams show that AI can turn static CAD drawings into smart, searchable data, saving engineers hours of manual review.
The SuperKnowva Pipeline: From Image to Explanation
How do we turn your raw upload into a personalized tutor? It’s a mix of vision and language working in perfect sync:
- Segmentation: We slice the image into semantic chunks such as labels, arrows, and shapes.
- Feature Extraction: We identify the intent, such as a flow chart, a classification tree, or a cycle.
- LLM Integration: We feed these structural insights into Large Language Models (LLMs) to generate natural language explanations.
- Personalization: The explanation adapts to the user. For a freshman, we keep the mitochondria explanation simple. For a medical student, we explain the electron transport chain.
Analyzing scientific diagrams doesn’t have to be a solo struggle anymore. With the right tech, every arrow becomes a gateway to a deeper conversation.
Supporting Visual Learners and Accessibility
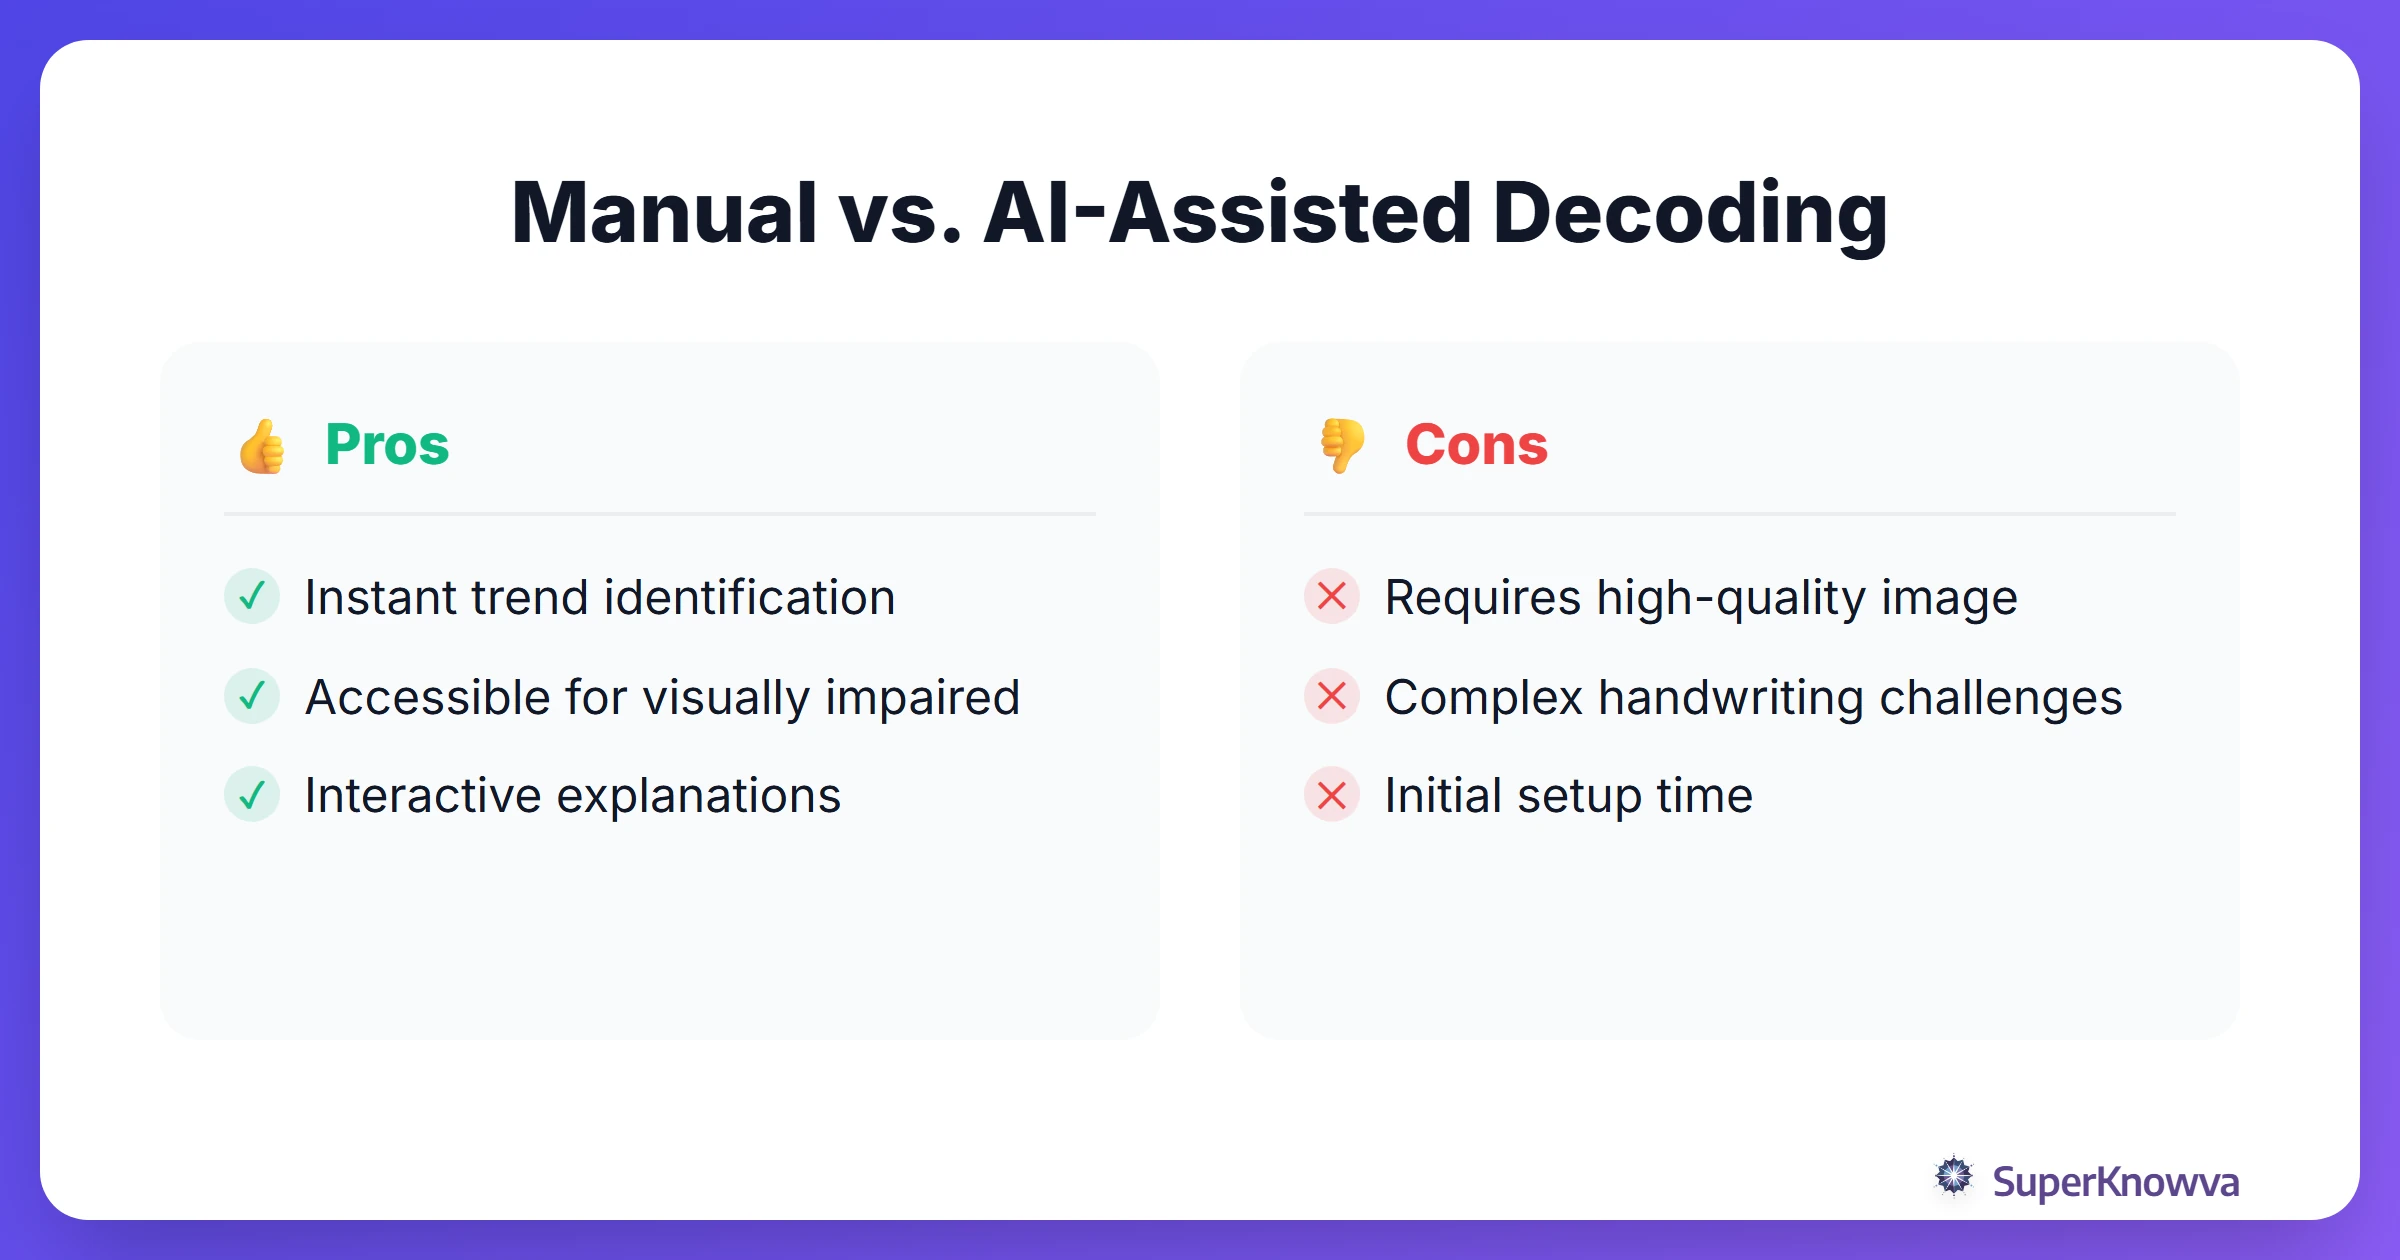
The most exciting part of AI diagram recognition is how it makes education more inclusive. Visual learners can turn a boring page into an interactive quiz, which is huge for active recall.
But it goes deeper than that. This technology is a pillar of Inclusive Learning. For students with visual impairments, AI can generate rich "Alt-text" or descriptive audio, explaining the relationships in a diagram that would otherwise be invisible.
And we’re just getting started. Moving beyond static images, AI for science simulations is creating environments where you can actually manipulate the variables you see on screen.
Conclusion
The days of being "stuck" on a confusing textbook illustration are over. By using ai diagram recognition, SuperKnowva is turning every image into a conversation. Whether you’re tracing a circuit or memorizing the bones of the hand, we’re here to make sure you see the full picture.
Ready to see your study materials in a new light? Upload your first diagram to SuperKnowva today and experience the future of visual learning.